BounceZero Research - Data Study
By Ayoub Lebda, Founder
- Published July 13, 2026 - Dataset snapshot Q3-2026-preview - 8 min read
Key findings
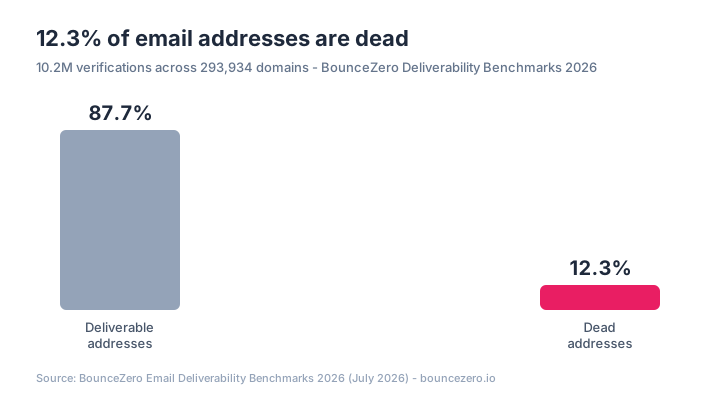
- - 12.3% of all addresses we verified are flat-out invalid - roughly one in eight emails on a typical B2B list bounces the moment anyone sends to it.
- - 33.1% of verification attempts hit catch-all domains - a third of the corporate email world can't be judged by the SMTP handshake alone.
- - Only 0.3% of checks failed at the DNS level (missing MX). The other ~97% of dead addresses live on perfectly healthy domains - which is why "MX checking" tools miss nearly everything.
- - Provider gap: addresses at Microsoft 365 domains came back 13.8% invalid, while addresses at Google Workspace domains came back 39.0% invalid - with catch-all configuration (5.2% vs 22.9% of checks) explaining much of the difference.
Methodology
This study aggregates 10,241,981 email verifications performed by the BounceZero
verification network between February 15 and July 12, 2026, covering
293,934 distinct recipient domains. Every verification runs the full pipeline -
syntax, DNS/MX resolution, provider fingerprinting, SMTP-level mailbox probing and catch-all
detection - and produces one classification: valid, invalid, risky or
unknown.
All figures are computed from domain-day aggregates; no individual addresses enter the benchmark
tables. Published segments follow a strict k-anonymity rule: a cell exists only if it
aggregates at least 50 distinct domains - smaller cells are absorbed into their parent
segment, never published. Every number in this article is frozen in the versioned snapshot
Q3-2026-preview and remains reproducible against it.
Finding 1 - One in eight addresses is already dead
Across the full corpus, 12.3% of verified addresses were invalid: the mailbox no
longer exists, and any campaign sent to it generates a hard bounce. This is not an exotic tail -
it is the ambient decay rate of business email. People change jobs, mailboxes get closed,
companies rename and fold. A list that was perfectly clean a year ago has quietly rotted, and
the sender is usually the last to know, because the feedback arrives as reputation damage rather
than as an invoice.
Copy this stat: "12.3% of 10.2M addresses verified between February and July 2026
were invalid - roughly one in eight." - BounceZero Research, Email Deliverability Benchmarks 2026
(bouncezero.io/email-deliverability-benchmarks-2026)
Mailbox providers track bounce rates per sender, and the commonly cited tolerance before
reputation penalties is around 2%. An untouched list carrying the ambient 12.3% failure rate
exceeds that threshold six times over on the first send.
Finding 2 - A third of the corporate internet is catch-all
33.1% of verification attempts landed on catch-all domains - mail servers
configured to accept delivery for any address at the domain, real or not. For a sender,
catch-all is the fog of war: the SMTP conversation says "accepted" whether or not a human will
ever read the message. This single configuration choice is why naive verification (send RCPT TO,
read the reply) systematically over-reports validity, and why serious verification needs
secondary evidence: domain reputation history, mailbox-pattern analysis, and provider-specific
probing strategies.
One important correction, from a follow-up we ran on this exact number: the 33.1% is real but the
"corporate internet" framing is too generous.
Nearly
two-thirds of that catch-all comes from just two consumer providers that block SMTP probing -
not from accept-all business domains. On mail you can actually probe, true catch-all is closer to
1.4%. "Catch-all" is really two different problems wearing one label.
Finding 3 - The failure lives at the mailbox, not the domain
Only 0.3% of checks failed for domain-level reasons (no MX records - the domain
cannot receive mail at all). Set against the 12.3% of dead addresses, the implication is stark:
about 97% of invalid addresses live on domains that look perfectly healthy from the
outside. Tools that "verify" by checking DNS and MX records - a popular shortcut because
it is free and fast - are structurally blind to nearly the entire problem.
Copy this stat: "97% of dead email addresses live on healthy domains - DNS-level
checks catch almost none of them." - BounceZero Research, 2026
Finding 4 - Microsoft 365 vs Google Workspace: a 25-point gap
The two dominant corporate mail platforms behave very differently in verification data.
Across 93,537 Microsoft 365 domains, 13.8% of checked addresses were invalid and
only 5.2% of checks hit catch-all configurations. Across 45,477 Google Workspace
domains, 39.0% of checked addresses came back invalid, and 22.9% of checks hit
catch-all setups.
Two forces drive the gap. First, Workspace makes catch-all configuration trivially easy, and
smaller companies - over-represented among Workspace domains - use it liberally, which both
masks dead mailboxes and encourages address-guessing by list vendors. Second, list builders
guess patterns (first.last@) far more aggressively against small companies, and
those guesses concentrate exactly where Workspace lives. The practical takeaway for senders:
segment your verification expectations by provider - a "verified" flag means
different things behind different mail platforms.
We dug into this gap in a dedicated follow-up, and the result is worth stating plainly here:
once
you control for domain size, the 25-point gap all but disappears (9.1% vs 10.9% invalid on
established domains). The headline difference is a composition artifact - what genuinely differs
between the two platforms is catch-all prevalence, not mailbox validity.
Finding 5 - What is actually in your list: a 500,000-address provider snapshot
Benchmarks only help if you know how your own list maps onto them. To make that concrete, we pulled a
fresh window of 500,000 real verifications from the last 30 days and broke the verdicts
down by mailbox provider. The pattern is unmistakable - list quality is not uniform, and it is heavily
determined by where the addresses live.
| Provider |
Verified |
Invalid |
Catch-all |
What it means |
| Gmail / Googlemail |
93.8% |
2.9% |
0.0% |
The cleanest tier - most lists are dominated by these. |
| French ISPs (Orange/SFR/Free) |
99.2% |
0.7% |
0.0% |
Essentially clean in this window. |
| Yahoo / Ymail |
0.2% |
1.5% |
50.2% |
Mostly catch-all - treat as a risk tier, not "valid". |
| AOL |
34.5% |
2.5% |
10.2% |
Catch-all-heavy; verify individually. |
| Outlook / Hotmail / Live |
19.0% |
78.0% |
0.0% |
The riskiest tier - this address space is aggressively recycled and burned. |
Three conclusions follow. First, an overall "10% invalid" hides huge variance - a list
that is 90% Gmail is nearly clean, while a list heavy in Hotmail or Yahoo addresses needs serious
hygiene. Second, catch-all is not evenly distributed: it is a Yahoo and AOL phenomenon in
this window, so a blanket "it's catch-all, move on" policy is wrong for lists that skew other ways. Third,
an honest "unknown" (30% of this window) is a feature, not a bug - it is what a verifier
returns when it cannot prove the mailbox either way, and it is exactly the segment that deserves a
re-check, not a guess. Sample window: last 30 days of production traffic; provider attribution is
fingerprint-based and conservative, consistent with the study-wide methodology.
Limitations
This corpus is our verification network's live traffic, not a random sample of the world's email.
It over-represents the kinds of lists people bring to a verification service - cold-outreach and
lead-generation lists - and includes large validation campaigns that over-weight certain
geographies and ISPs in absolute volume (which is why this study reports provider and
domain-diversity figures rather than raw geographic league tables). Catch-all prevalence is
measured per verification attempt, not per unique domain. Provider identification is
fingerprint-based and conservative; domains we could not attribute are excluded from Finding 4.
Numbers describe our February-July 2026 window and will be re-published against the frozen
Q3-2026 snapshot in October.
What senders should do with this
The ambient numbers say a list decays toward ~12% dead in the ordinary course of business, a
third of your targets can't be judged by handshake alone, and the free shortcuts see 3% of the
problem. The operational conclusion is unglamorous: verify before every send, not once a
year - and treat catch-all results as a risk tier of their own rather than as "valid".
That "not once a year" is not rhetorical. In a companion study we followed 826,000 addresses
verified twice and measured exactly how fast a clean list rots:
of
addresses re-checked past 90 days, only 19% were still valid. The half-life of a validated
list is measured in weeks.
Related reading: the cold email deliverability guide,
how catch-all detection works,
and the full deliverability handbook.
You can check a list against these benchmarks with the free verifier.
About this research. BounceZero Research publishes original deliverability data
from the BounceZero verification network under a strict aggregation and k-anonymity charter: no
addresses, no per-organization data, cells of 50+ domains only, versioned snapshots for every
published figure. Questions about methodology:
contact us.